Observe
0. Required Metrics
Container and pod metrics are used to determine recommendations for individual workloads. Node and cluster metrics are used to determine cost and overall cluster health.
If you have custom metric names, please contact us for further assistance.
Expand to see all queries that Flightcrew runs (filtered by cluster)
| Metric Type | Query |
|---|---|
| CPU Capacity | align 1m, A:avg(m("k8s_node_allocatable_cpu")) |
| CPU Capacity | align 1m, A:avg(m("k8s_node_allocatable_cpu")) |
| CPU Limit | align 1m, A:avg(m("k8s_container_cpu_limit")) |
| CPU Request | align 1m, A:avg(m("k8s_container_cpu_request")) |
| CPU Usage | align 1m, A:avg(m("container_cpu_usage")) |
| Container Restart Count | align 1m, A:delta(m("k8s_container_restarts")) |
| Memory Capacity | align 1m, A:avg(m("k8s_node_allocatable_memory_bytes")) |
| Memory Capacity | align 1m, A:avg(m("k8s_node_allocatable_memory_bytes")) |
| Memory Limit | align 1m, A:avg(m("k8s_container_memory_limit_bytes")) |
| Memory Request | align 1m, A:avg(m("k8s_container_memory_request_bytes")) |
| Memory Usage | align 1m, A:avg(m("container_memory_working_set_bytes")) |
| Status Phase | align 1m, (A:min(m("k8s_pod_phase"))) |
1. Create API Token
-
If you have access to the Observe Authtokens UI (in preview), go to your instance's UI to create an API token. Read more about API tokens here.
-
Otherwise, click here to create an API token from CLI to access your Observe data. You can read more about the Observe endpoints here.
-
Please keep in mind the Observe API token expiration policy. If you decide to migrate clusters after a month and stop using the generated API token for more than 24 hours, you may have to create a fresh API token upon tower reinstall.
From Observe API Authentication:
Bearer tokens are tied to specific users, and by default are valid for 30 days. API Tokens are also automatically renewed on use. However, if an API Bearer token goes unused long enough that its expiration will occur within 9 days or less, it will be extended as “valid” for 10 more days from the point of use. Token time to live is the same for Tokens generated via the CLI or via REST.
From Observe's Token Expiration:
Tokens last 31 days after minting. After 31 days, the token must be used at least once in every 24 hour period to remain active. After the first month has passed, an unused token will expire after one day.
-
2. Find the Prometheus Metrics Dataset
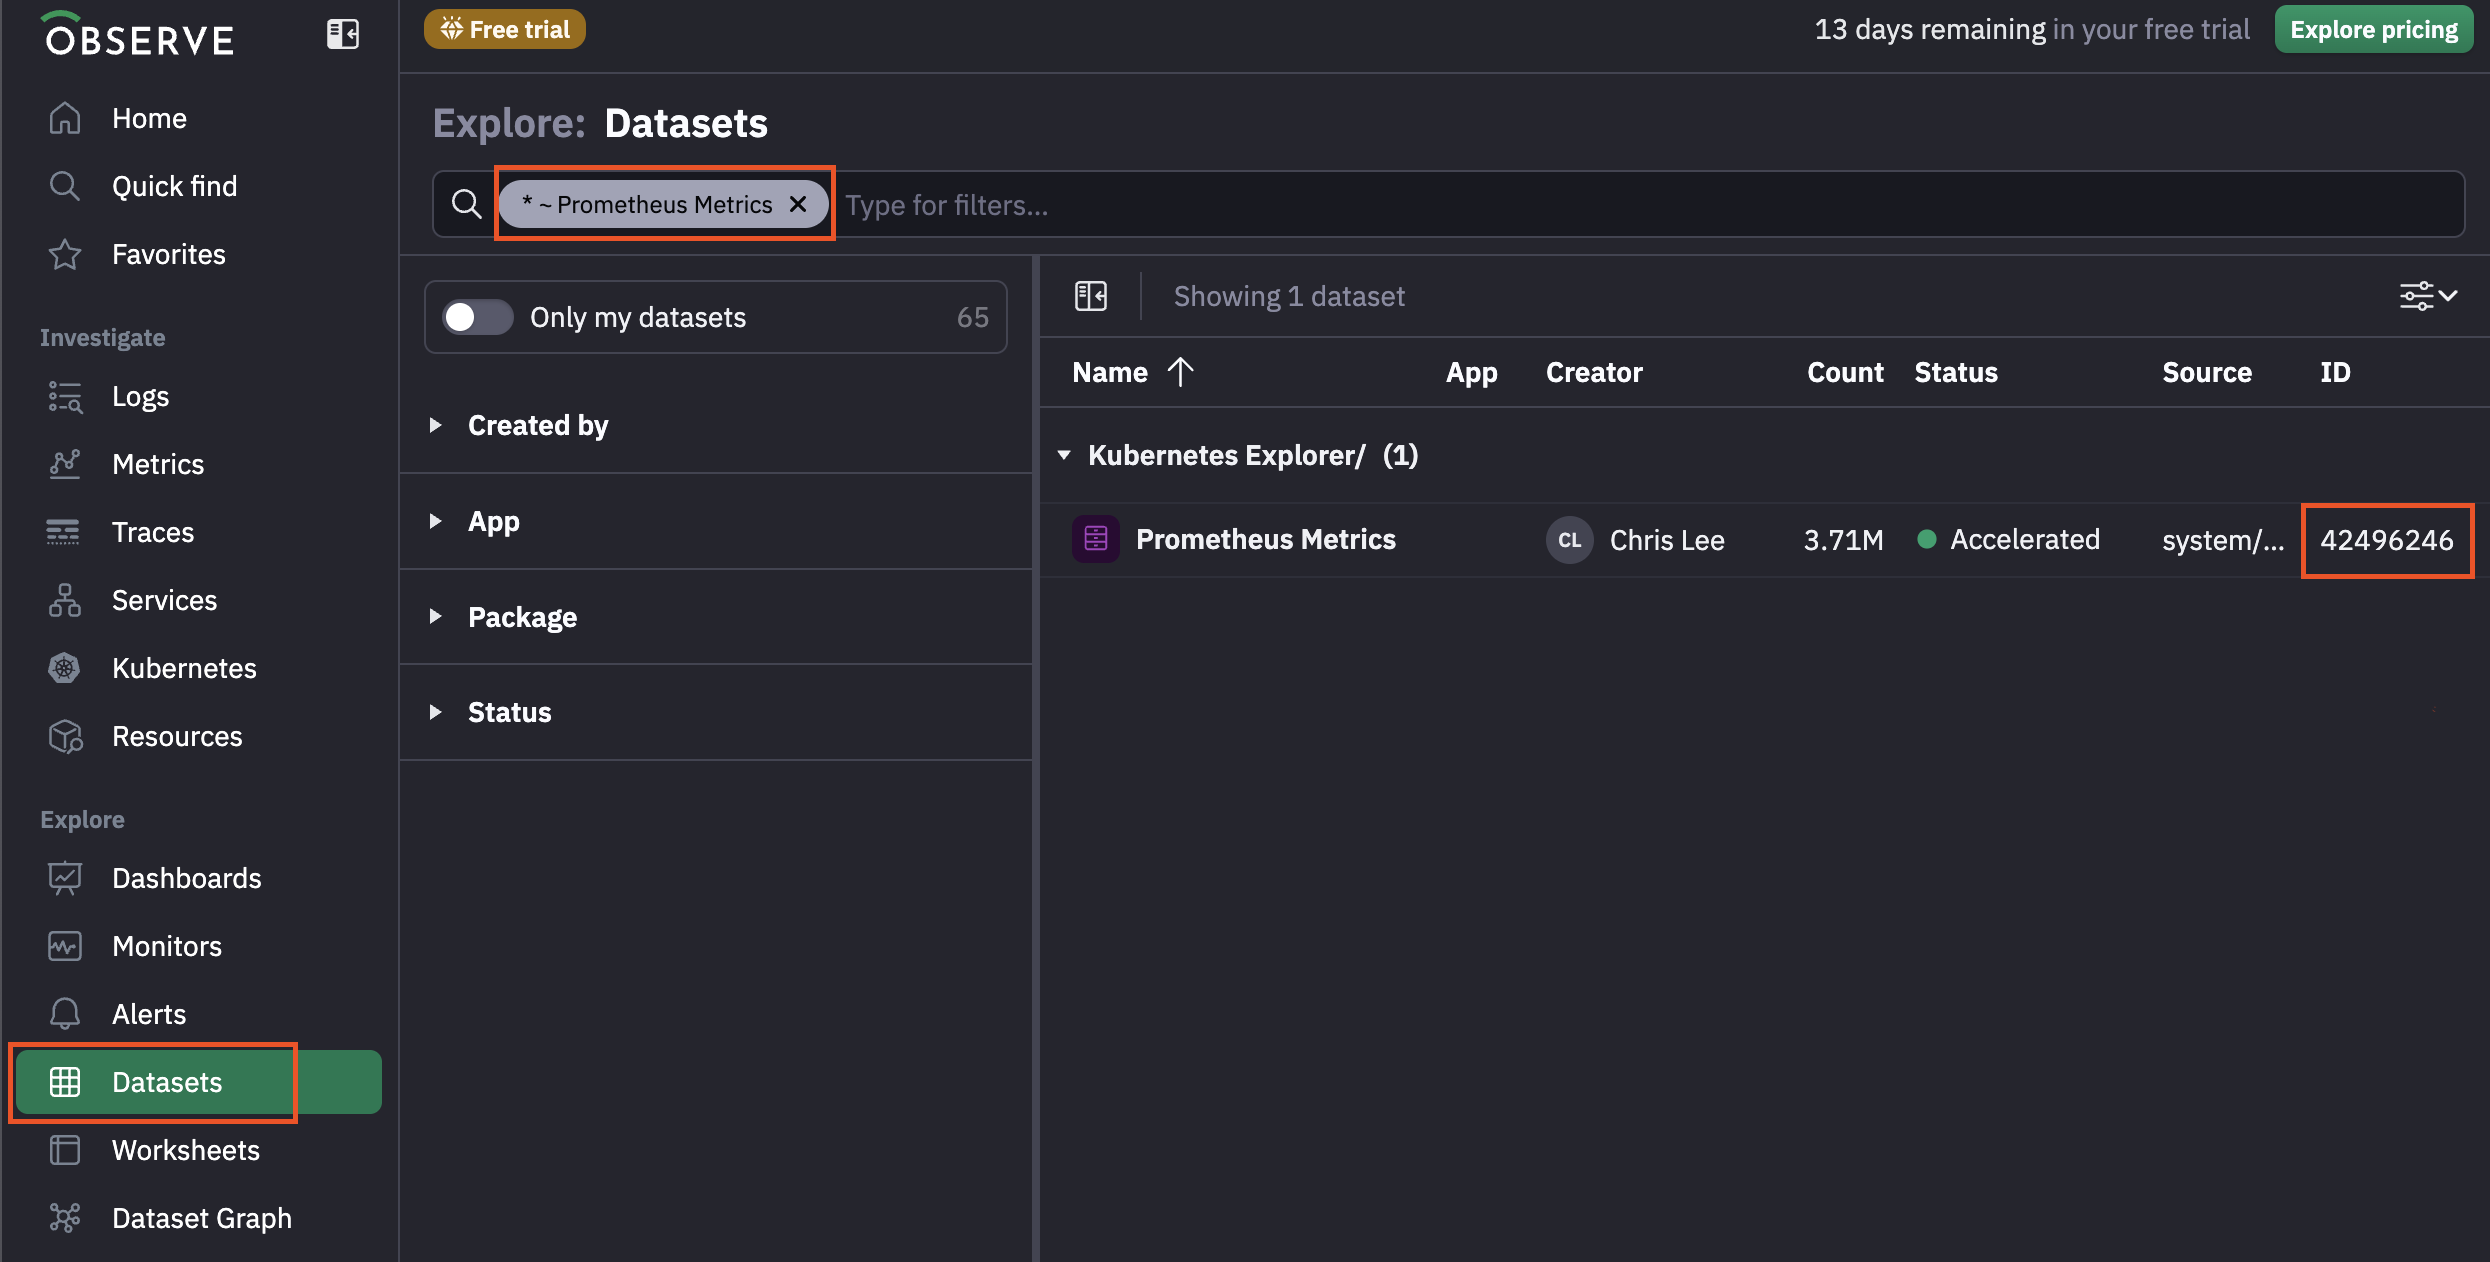
- Go to your Observe instance.
- Click on Datasets in the left navigation sidebar.
- Search for "Prometheus Metrics".
- Optionally verify that the datastream includes your desired cluster.
- Copy the dataset ID.
3. Set Environment Variables
We'll set up some environment variables for the Tower. Optional environment variables are denoted as optional.
| Name | Description |
|---|---|
OBSERVE_API_TOKEN | Set to the API token created above. |
OBSERVE_CLUSTER | (optional) This is your Observe cluster if your Observe URL is like https://{customer_id}.{cluster}.observeinc.com. |
OBSERVE_CUSTOMER_ID | This is your Observe customer ID from your Observe URL like https://{customer_id}.observeinc.com. |
OBSERVE_DATASET_ID | Set to the dataset ID you found above. |
OBSERVE_DOMAIN | (optional) This is your custom Observe domain if you have one. Set to example.com if your Observe URL ois https://{customer_id}.example.com. |
4. Verify API Access
We'll curl Observe's API directly to make sure the response has the data Flightcrew will be looking for.
4.1. Set Observe API Endpoint
Based on what your Observe UI endpoint looks like, pick the endpoint that matches what you expect.
# Example: https://1234567890.observeinc.com
export OBSERVE_ENDPOINT="https://${OBSERVE_CUSTOMER_ID}.observeinc.com"
# Example: https://1234567890.eu-1.observeinc.com
export OBSERVE_ENDPOINT="https://${OBSERVE_CUSTOMER_ID}.${OBSERVE_CLUSTER}.observeinc.com"
# Example: https://1234567890.example.com
export OBSERVE_ENDPOINT="https://${OBSERVE_CUSTOMER_ID}.${OBSERVE_DOMAIN}"
4.2. Query the API
We will pull 10 rows of metric data from the last 10 minutes for pod memory usage bytes.
curl "${OBSERVE_ENDPOINT}/v1/meta/export/query?interval=10m&paginate=false" \
  --request POST \
  --header 'Accept: text/csv' \
  --header "Authorization: Bearer ${OBSERVE_CUSTOMER_ID} ${OBSERVE_API_TOKEN}" \
  --data "$(cat <<EOF
{
  "query": {
    "outputStage": "A",
    "stages": [
      {
        "input": [
          {
            "inputName": "Kubernetes Explorer/Prometheus Metrics",
            "datasetId": "${OBSERVE_DATASET_ID}"
          }
        ],
        "stageID": "A",
        "pipeline": "align \"A\":avg(m(\"container_memory_working_set_bytes\"))\naggregate \"A\":sum(@.\"A\"), group_by(labels.k8s_container_name, labels.k8s_namespace_name, labels.k8s_pod_name)"
      }
    ]
  },
  "rowCount": "10"
}
EOF
)"
The output should be a CSV, looking similar to:
"k_s_container_name","k_s_namespace_name","k_s_pod_name","_c_bucket","A","valid_from","valid_to"
"""aws-node""","""kube-system""","""aws-node-hhgg7""","29162657",40124416,"1749759420000000000","1749759480000000000"
"""cluster-metrics""","""observe""","""observe-agent-cluster-metrics-7fbf86cc77-pkjms""","29162657",30674944,"1749759420000000000","1749759480000000000"
"""forwarder""","""observe""","""observe-agent-forwarder-agent-jplj7""","29162657",25280512,"1749759420000000000","1749759480000000000"
"""prometheus-service-configmap-reload""","""monitoring""","""prometheus-service-7759869869-7gvph""","29162657",11177984,"1749759420000000000","1749759480000000000"
"""agent""","""monitoring""","""datadog-agent-gkcc5""","29162657",169951232,"1749759420000000000","1749759480000000000"
"""process-agent""","""monitoring""","""datadog-agent-gkcc5""","29162657",63299584,"1749759420000000000","1749759480000000000"
"""trace-agent""","""monitoring""","""datadog-agent-xjnq9""","29162657",23601152,"1749759420000000000","1749759480000000000"
"""control-tower""","""flightcrew-datadog""","""control-tower-dd-79c4b4cc5d-nclkb""","29162657",25767936,"1749759420000000000","1749759480000000000"
"""agent""","""monitoring""","""datadog-agent-m7qdv""","29162657",134459392,"1749759420000000000","1749759480000000000"
"""node-logs-metrics""","""observe""","""observe-agent-node-logs-metrics-agent-4hns8""","29162657",41099264,"1749759420000000000","1749759480000000000"
If so, verification is done.
Troubleshooting
If your output looks like {"ok":false,"message":"authorization failed"}, make sure to create an API Token.
If you get no rows in your CSV, the environment variables may not be set properly, or your Observe datastreams may not be collecting metrics properly. Double check the environment variables you set earlier, and verify that your datasets in the Observe UI have values.
If the problems persist, please reach out for support.